import streamlit as st

import numpy as np
import pandas as pd
import altair as altA first view on Streamlit
fastai
A first view on Streamlit
I had a look into streamlit as anoter way to deploy a data science app. It seems really convenient to work with.
Unfortunately, I cannot use it on a static website, so I need to learn how to deploy it on a service with Docker.
Tutorial
I went through the getting started tutorial, below are the main steps.
We import streamlit as a separate package and simply run it in as script.
streamlit run first_app.pyThis, by default, creates a local server where we can see the results.
Streamlit tries to diplay everything, somehow similar how it happens in a jupyter notebook.
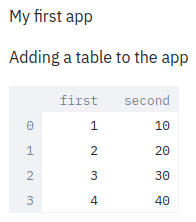
df = pd.DataFrame({"first": [1, 2, 3, 4], "second": [10, 20, 30, 40]})

df| first | second | |
|---|---|---|
| 0 | 1 | 10 |
| 1 | 2 | 20 |
| 2 | 3 | 30 |
| 3 | 4 | 40 |
chart_data = pd.DataFrame(np.random.randn(20, 3), columns=["a", "b", "c"])

st.line_chart(chart_data)
<streamlit.delta_generator.DeltaGenerator at 0x7fd5941fdc70>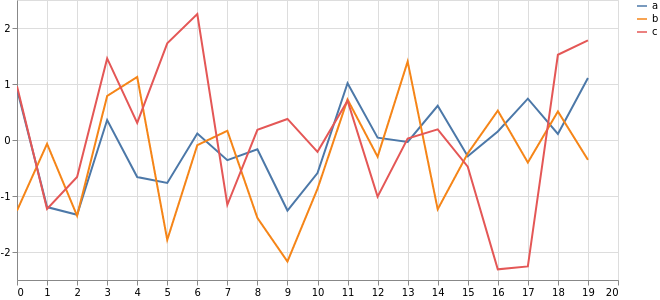
map_data = pd.DataFrame(
    np.random.randn(1000, 2) / [50, 50] + [37.76, -122.4], columns=["lat", "lon"]
)

st.map(map_data)
<streamlit.delta_generator.DeltaGenerator at 0x7fd5941fdc70>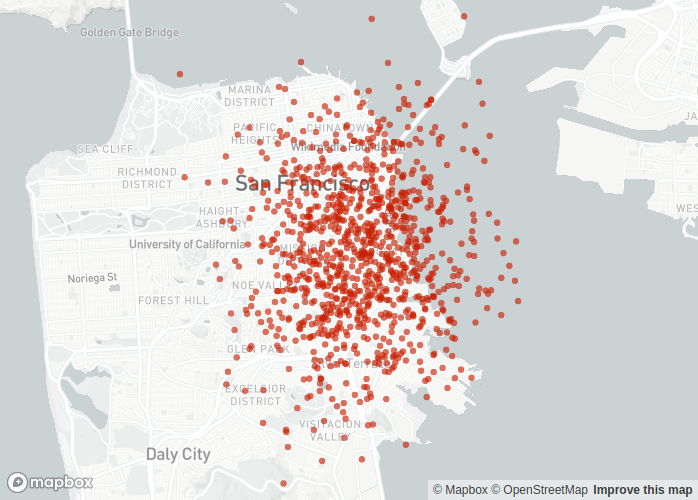
if st.checkbox('Show dataframe'):
    chart_data = pd.DataFrame(np.random.randn(20, 3), columns = ['a', 'b', 'c'])

    st.line_chart(chart_data)


option = st.sidebar.selectbox("Which number do you like best?", df['first'])

'You selected ', df.loc[df['first'] == option, :]
('You selected ',
first second
0 1 10)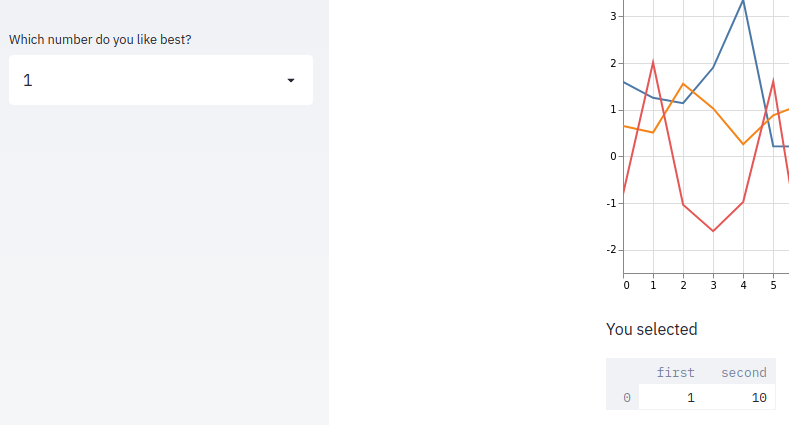
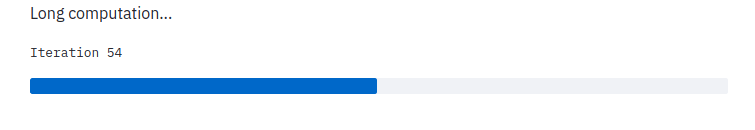
import time

"Long computation..."

# Add a placeholder
latest_iteration = st.empty()
bar = st.progress(0)

for i in range(100):
    # Update progress bar with each iteration
    latest_iteration.text(f"Iteration {i + 1}")
    bar.progress(i + 1)
    time.sleep(0.1)

"...and done!"
'...and done!'